DATA ANALYTICS
Analytics Your Competitors
Can’t See

An Unmatched Advantage: Unified Analytics & Experts
Unlock your own strategic advantage with our data analytics services, a unified combination of our channel experts and custom Convergence Dashboard implementation. We offer comprehensive data integration and dashboard construction services tailored to meet diverse needs and seamlessly integrate third-party accounts like Shopify, Google Ads, and TikTok, to enhance your data insights. Our channel experts are adept at tailoring these integrations, from setup to management, enhancing overall marketing and commerce effectiveness, leveraging real-time data for continuous strategy validation or refinement.
Our data analytics services include the creation of both single and multi-brand dashboards, offering executive and detailed views that allow for strategic analysis of marketing, site performance, and customer behavior across different brands. Each dashboard provides an executive summary, detailed marketing and acquisition insights, and in-depth analyses of store performance to optimize your business strategies.
The Full-Funnel Conversion Intelligence Framework (FFCI)
1. Signal Capture
Monitor the upstream forces shaping demand before a user clicks — PR sentiment, brand search velocity, AI citation frequency, and competitive share-of-voice across ChatGPT, Gemini, Perplexity, and AI Overviews.
2. Authority & Inclusion Scoring
Measure how AI agents evaluate your brand. Track inclusion probability, structured data integrity, schema coverage, and competitive win rate inside AI-generated recommendations.
3. Journey Intelligence
Map the cross-channel pathway most analytics stacks miss:
Earned media → AI agent citation → referral session → on-site behavior → checkout event.
Full-funnel attribution, not last-click reporting.
4. Conversion Rate Optimization (CRO)
Optimize landing pages, checkout flows, and subscription logic informed by upstream acquisition quality. Smarter testing because you understand intent before the visit.
5. Agentic Revenue Attribution
Instrument prompt-to-purchase tracking. Attribute revenue to specific AI ecosystems, media placements, and acquisition sources using GA4, Shopify Web Pixels, and server-side tracking.
6. Predictive & Operational Intelligence
Detect performance shifts before they appear in standard dashboards. Powered by Z/OS, our internal AI system that accelerates signal detection, optimization cycles, and reporting precision.
Data Analytics Channel Experts
At Avenue Z, we bring together a powerhouse of strategic thinkers and industry leaders that can turn data analytics into actionable marketing and eCommerce strategies.
The Execution Layer: Convergence Dashboard
The Convergence Dashboard operationalizes FFCI. Built on Looker Studio with direct integrations to Shopify, GA4, BigQuery, Meta, Google, TikTok, and 30+ platforms, it consolidates AI-attributed revenue, media efficiency, and lifecycle metrics into a single decision layer.
From commerce to conversion metrics, this powerful tool streamlines data analysis and enhances decision-making, enabling marketing teams to devise and implement strategies with unprecedented precision and speed. An indispensable co-pilot for marketing professionals, this tool redefines the way marketing data is analyzed and utilized for strategic advantage.


Data Analytics Access, Insights, Action
Our channel experts work with you to implement The Convergence Dashboard and customize based on your needs, alignment with your strategic vision, or key areas of optimization. They support our data analytics offering through the entire process:
- Data Source Integration
We integrate a variety of third-party accounts such as Shopify, Google Ads, Google Analytics, TikTok, Meta, Klaviyo, and Recharge, facilitating comprehensive data access and management. This streamlines operations and enhances data-driven decision-making across multiple platforms. - Dashboard Build-Out
We craft customized dashboards tailored to both single and multi-brand operations, providing brand-specific insights and executive overviews. These dashboards offer comprehensive views for each brand individually, as well as comparative metrics across multiple brands, enabling deep analytical dives and strategic oversight. - Custom Views Set Up
We tailor custom views based on your business, strategy or needs. Example views include the Executive Summary, which highlights trends and discrepancies across crucial business areas like orders, website activity, and marketing performance. Marketing & Acquisition and Deep Dive Analysis views, focus on channel effectiveness, creative performance, and in-depth evaluations of store operations and customer behavior.
Powering Data Analytics for Global Brands
Unified Metrics Across Top Data Partners
With the Convergence Dashboard, we enhance operations by integrating your top business intelligence tools, and pulling out key metrics, for more efficient data analysis and insights. View business performance and profitability side-by-side with paid media performance, contribution margin, media mix, cohort analyses and sales channel performance, all in one place.
From Amazon to Shopify, Meta to TikTok, AdWords to Analytics, The Convergence Dashboard pulls in key metrics from all of the top data providers that help you run your business.Whether you’re driving commerce or conversion, or looking to see a lift in connections and comms, the dashboard is customized to your specific data movement, transformation and activation needs.
Top Dashboard Views
Performance Highlights
View gross revenue, net revenue, ad spend, contribution margin, and cost per acquisition (CPA) for performance analysis. Interactively explore these metrics across various time frames, such as month-to-date and year-to-date comparisons, facilitating a comprehensive understanding of business trends and financial health.
Orders Performance
View new and repeat customer orders, revenue, cost per acquisition (CPA), cost per order (CPO) and average order value (AOV). Analyze month-to-date and year-over-year comparisons, highlighting significant increases in customer acquisition, repeat business, advertising efficiency and overall financial performance.
Cart Performance
Monitor cart performance metrics like conversion rate, sessions, add-to-cart rate, and checkout initiation. Compare these metrics month-to-month or year-over-year to identify trends or anomalies, aiding in performance evaluation, strategic adjustments, understanding seasonal variations and optimizing website efficiency over time.
Business Performance
Track new versus returning customer orders and their revenue impact, viewing daily, weekly or monthly intervals for trend analysis and strategic decision-making. Examine detailed metrics like daily net revenue, average order value (AOV), and cost per order (CPO), providing valuable insights into customer value and subscription dynamics.
Retention & LTV
View retention and customer lifetime value (LTV), crucial for measuring long-term brand health. Explore detailed analysis of LTV across different customer segments like subscription versus one-time purchases, tracking LTV by acquisition source and campaign type over various time frames to refine marketing strategies and optimizing customer acquisition costs (CAC) based on real data.
Marketing Performance
Explore media mix across various channels like Meta, Google, and TikTok and analyze campaign tactics by channel, like prospecting, retargeting, retention, by campaign type and spend distribution. View daily, weekly, and monthly media mix and spend intervals, helping to optimize marketing strategies and ad spending effectively.
Site Performance
View detailed web analytics to analyze conversion rates and user engagement across different traffic sources like Facebook and paid search. Drill down into demographics, regions, and specific page performance, offering insights into user behavior and effectiveness of various marketing channels.
Creative Performance
Filter and analyze ad performance based on various criteria such as ad platform, ad type, and destination type. View the distribution of media budgets across different ad formats, track key performance indicators (KPIs) like return on ad spend (ROAS) and cost per acquisition (CPA), and see detailed metrics and previews of individual ads to understand what creatives are performing well across platforms.
Marketing Channels
Filter Meta data by campaign tactic, type, audience, and destination with a detailed look at key metrics like ad spend, platform revenue, return on ad spend (ROAS), average order value (AOV), cost per order (CPO), and cost per acquisition (CPA) across various time frames to identify trends and optimize marketing strategies by comparing performance across different campaign types and time periods.
Learn More About the Convergence Dashboard
-


Top of Stack: AI’s New Labor Reality, Regulatory Fragmentation, and the Capital Behind the Buildout
This week’s signals point to a more consequential phase for AI, as workforce disruption, state-by-state rulemaking, investor urgency, and…
-

Yahoo’s MyScout is the First Customizable Homepage for AI Answers
Yahoo Scout offers an “open web” friendly interface and personalized homepage, making it stand out from other AI platforms.
-


Meta Signs $27B AI Infrastructure Deal with Nebius
The Nebius agreement marks one of Meta’s biggest AI contracts, but it could also mean significant layoffs are coming.
-
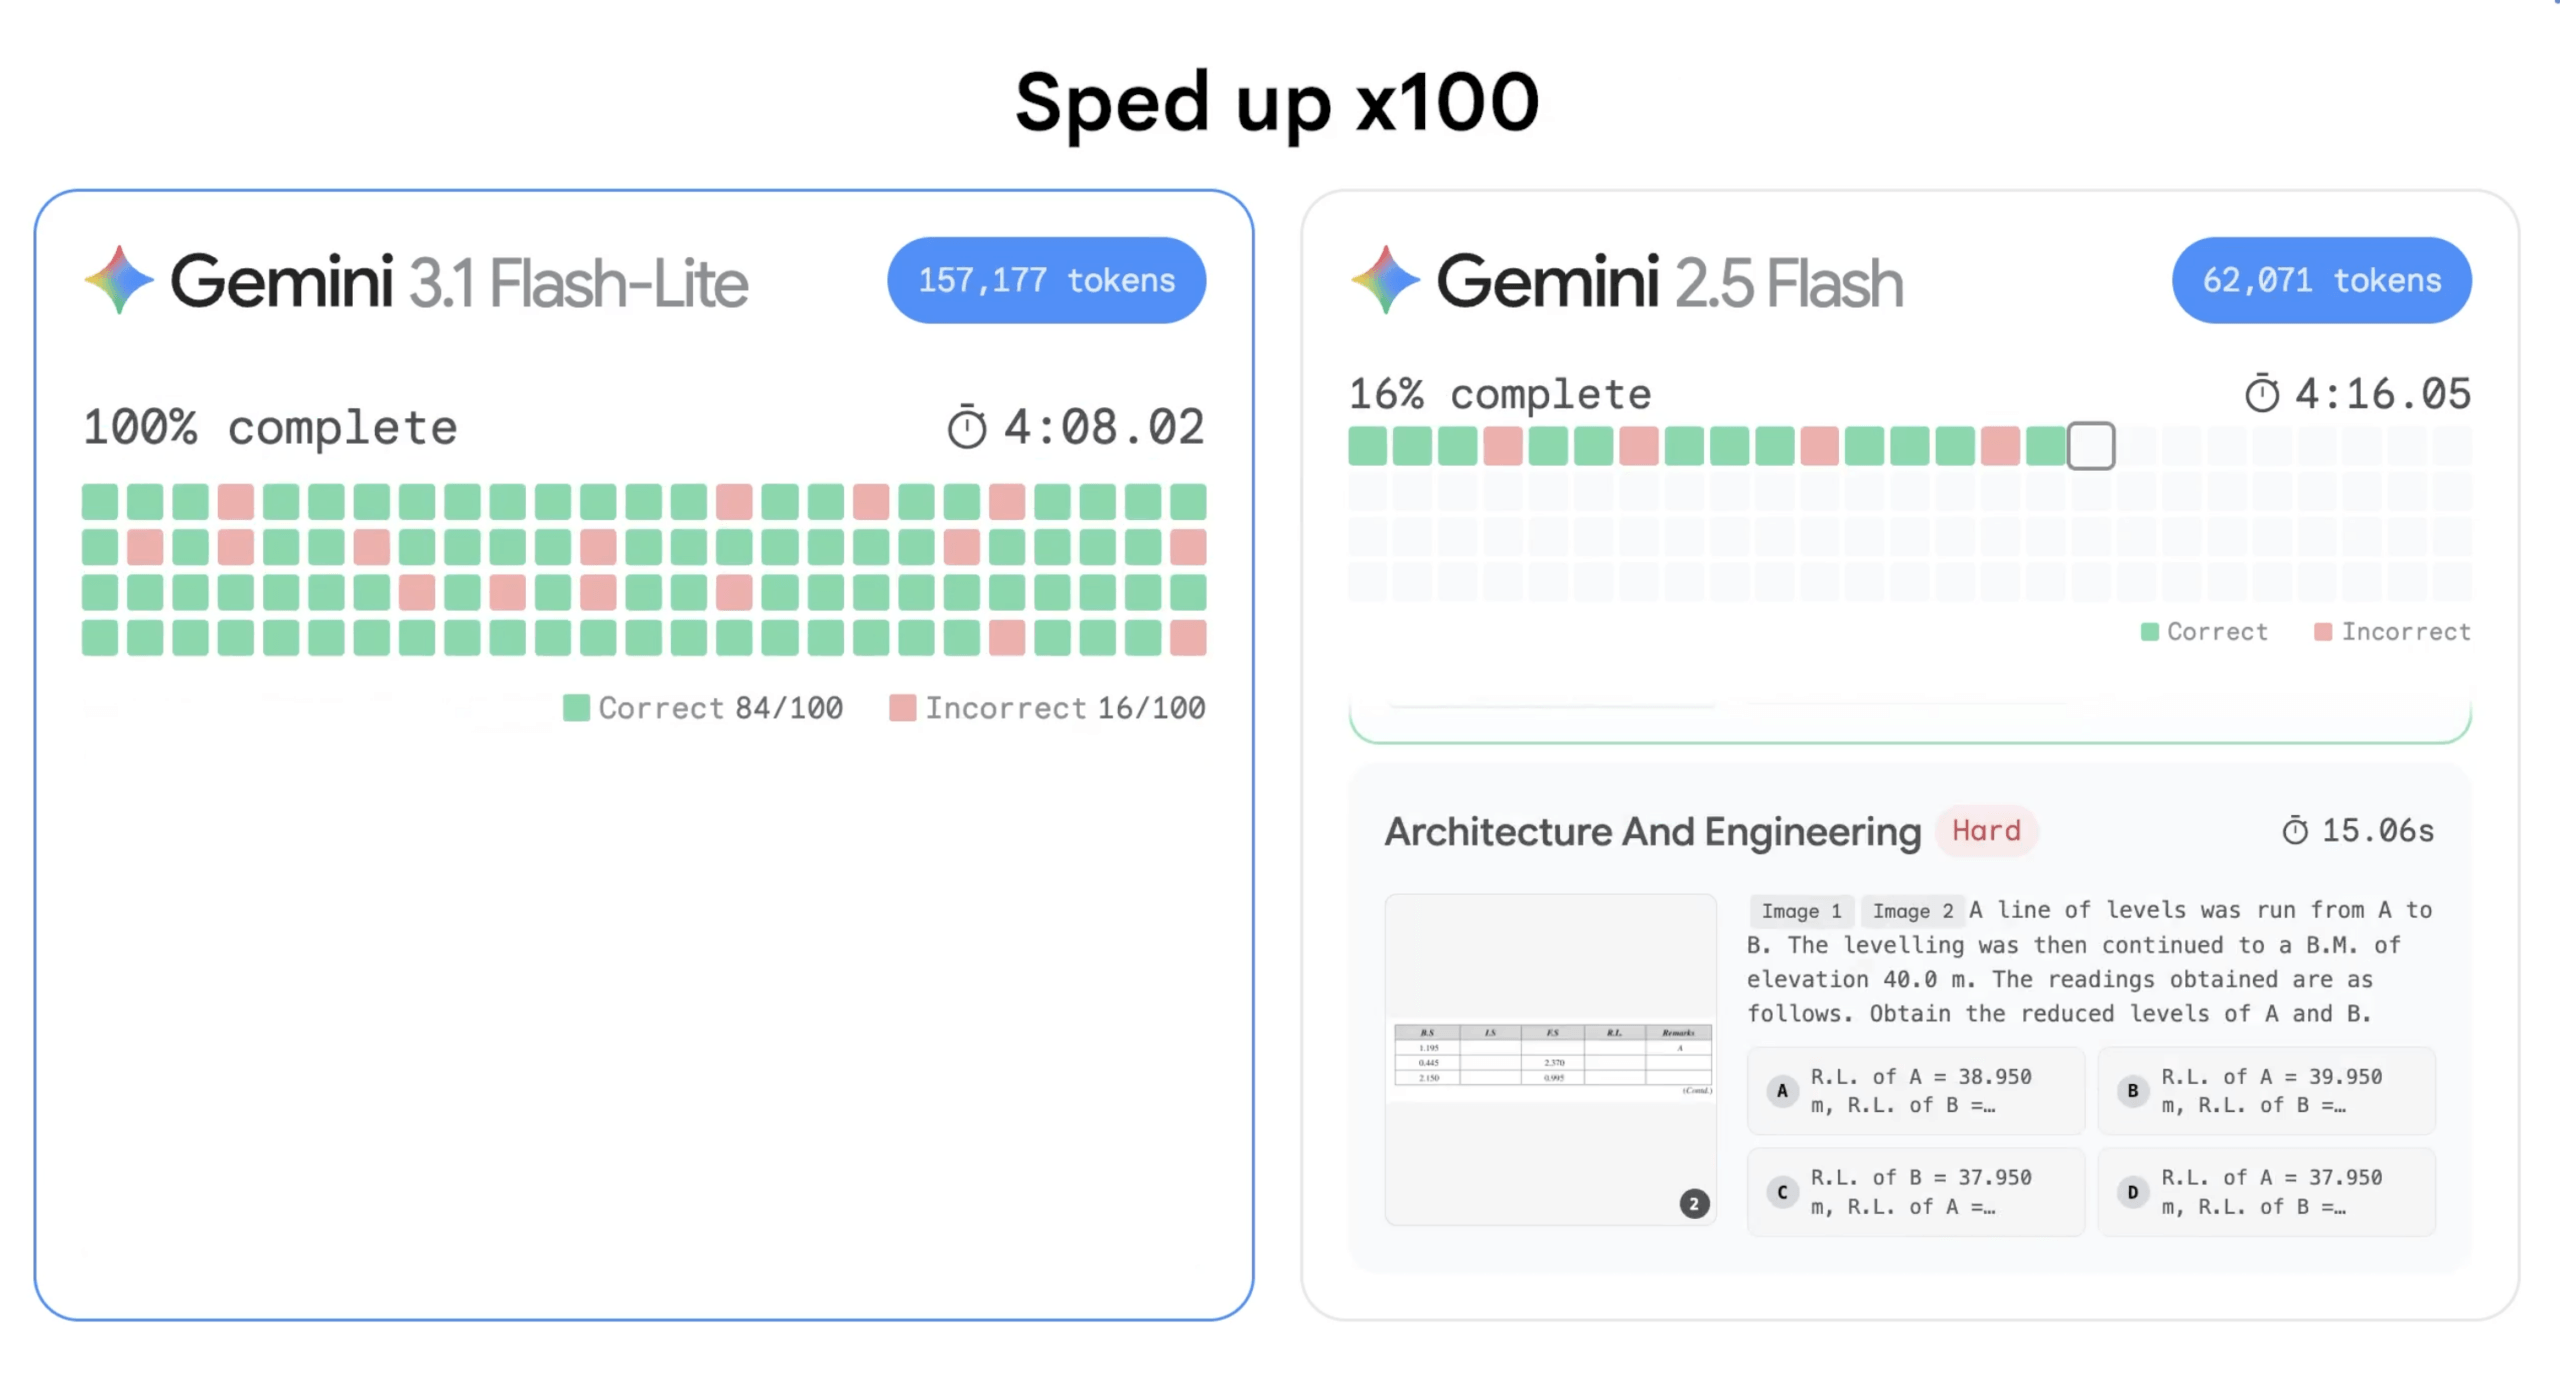
Gemini 3.1 Flash-Lite Offers Quality Responses at a Low Cost
The newest version of Flash-Lite has the perfect balance of speed and affordability mixed with knowledge and reasoning.
-


Triple Whale Launches Moby 2, the Next-Gen of eCommerce AI
Avenue Z’s partner, Triple Whale, announced an upgrade to their AI. Now, Moby 2 takes action and helps run…
-

You’re More Than Your Product: Building a Narrative for Complex Financial & AI Platforms
Why explaining how your platform works should come second to driving influence in your industry.
Find Out What Your Analytics Are Missing
Schedule Your Consultation
Fill out the form below and one of our account strategists will be in touch to schedule a data analytics consultation.