Today, Social Commerce drives rapid and dynamic interactions akin to a bustling marketplace at peak hours, so mastering the nuances of order performance and site optimization is crucial for staying ahead. This is where the Convergence Dashboard steps in. In the accompanying videos, I’ll personally walk you through the key metrics that drive our site performance and influence customer transactions. Join me as we dive deep into these essential metrics, ensuring you have the insights needed to excel in decision-making and strategic planning.
Orders Performance: Unlocking Insights with the Orders Performance View
To run an e-commerce business at peak potential, tracking and understanding the nuances of order performance is essential. In our Convergence Dashboard, the Orders Performance View provides an in-depth look at various metrics, offering a comprehensive snapshot to help businesses stay on top of their game. See the video below for a quick tour.
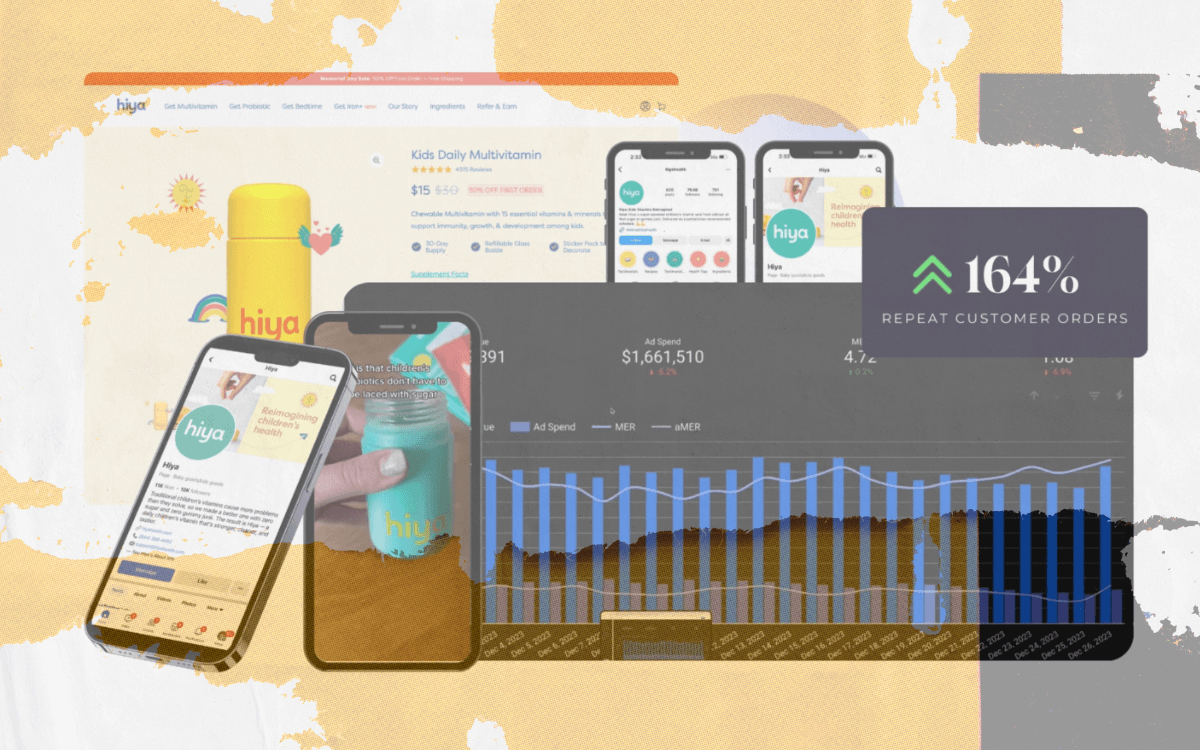
The Orders Performance View isn’t just another dashboard; it’s a dynamic tool designed to drill down into the specifics of order metrics. At the heart of this view is the ability to toggle between new and repeat customer orders, providing a clear picture of customer engagement trends. For example, this month, new customer orders are up by 4% compared to last month, while repeat customer orders have also seen a 3% increase. This positive trend offers a reassuring sign of both growth and customer retention.
Highlighting any particular day reveals the exact quantity of orders, making it easy to spot daily fluctuations and respond accordingly. This feature is invaluable for businesses aiming to understand short-term shifts and adjust their strategies in real-time.
Year-Over-Year Growth
Looking at the bigger picture, the year-over-year analysis is crucial for assessing long-term performance. Our system allows for a quick comparison of current month performance against the same month in the previous year. Impressively, new customer acquisition is up 62% year over year, and repeat customer orders have skyrocketed by 140%. These figures are not just numbers but are testaments to the effective strategies implemented by the business.
In addition, the average order value (AOV) has increased by 13% over the past year, indicating not only more orders but more valuable ones, contributing positively to overall revenue growth.
Comprehensive Trend Analysis
The versatility of the Orders Performance View extends to its ability to track year-to-date trends against the previous year. This is an easy way to spot any anomalies or significant changes that may need further investigation. The view also covers various preset comparisons like yesterday versus the previous day, and last 7 days over the previous 7 days, among others, encompassing all critical order-related metrics such as new customer orders, repeat customer orders, AOV, cost per acquisition (CPA), and cost per order (CPO).
Understanding CPA and CPO
The distinctions between CPA and CPO are particularly noteworthy. CPA is calculated by dividing new ad spend, which targets either prospecting or retargeting audiences, by new customer orders. This metric helps gauge the effectiveness of advertising dollars in converting prospects into new customers. On the other hand, CPO involves the overall ad spend divided by all orders, blending various metrics to provide a holistic view of the advertising expenditure efficiency.
Flexible Data Interaction
What sets the Orders Performance View apart is its adaptability. Users can toggle any date range they desire, and the graph adjusts accordingly, providing tailored insights that are crucial for strategic planning. This flexibility ensures that businesses can remain agile, adapting to market dynamics with precision and informed confidence.
Site Performance
Site performance is another mission-critical metric to monitor when optimizing any e-commerce business. In the video below, I break down how to analyze and interpret these metrics to ensure your business stays ahead.
Subscribe to our Newsletter
Get exclusive strategies and insider insights to boost your influence.
Month-to-Date Analysis: A Closer Look at Conversion Rates
Starting with the basics, one of the first things we examine is our month-to-date performance, comparing it against the prior month. By focusing on various metrics such as sessions, add-to-cart rates, initiate checkout rates, and ultimately conversion rates, we gain a comprehensive view of user engagement and sales effectiveness. This versatile approach allows us to select and compare any metric month over month up to the current day, helping us spot trends or sudden changes that might require a deeper dive to understand underlying causes.
Year-Over-Year Comparisons: Accounting for Seasonality
Another crucial aspect of our analysis involves comparing month-to-date performance with the same period in the previous year. This comparison is vital for understanding seasonal impacts on our metrics. For instance, seeing how we performed on January 5th, 2024, versus January 5th, 2023, can reveal consistent trends or deviations in consumer behavior, allowing us to anticipate future changes more accurately.
Dealing with Anomalies in Data
Sometimes, discrepancies in data can arise from external changes, such as updates to our analytics tools. For example, a significant variance might be observed because a tool like GA4 wasn’t set up in the previous year, leading to no data against which to compare this year’s performance. Understanding these nuances is crucial in accurately interpreting year-over-year metrics.
Navigating Through Our Dashboard: A Comprehensive Tool
Our analysis doesn’t stop at just observing. With tools at our disposal that allow us to simulate different scenarios or pick specific date ranges, we can manipulate metrics to see potential outcomes or deeper insights. This capability ensures that we’re not just passive observers of data but active analysts who can forecast and react to market dynamics.
Additionally, our dashboard provides a “scorecard” view that includes metrics from various stages of the sales funnel—starting from sessions down to conversion rates. This view is segmented into different time frames: yesterday, the last 7 days, and the last 30 days, offering us snapshots of short-term and medium-term performance.
Unifying Data Streams for Holistic Analysis
One of the biggest advantages we now have is the integration of our data sources. Whether it’s GA4 data or Shopify insights, having all this information in one view allows us to assess not just website performance but also paid media and overall business performance seamlessly. This integration ensures that we are not toggling between different platforms but instead have a unified view that simplifies decision-making and strategy formulation.
By harnessing the power of detailed analytics and making data-driven decisions, we can optimize our e-commerce operations and enhance overall business performance. It’s about turning data into actionable insights, and that’s exactly what we strive to master through our comprehensive site performance analysis.
Never Miss a Chance to Get Ahead
For businesses hungry for growth, adopting a data-driven approach is no longer just nice—it’s necessary. The Convergence Dashboard is a critical tool that helps make this a reality. For a dashboard demo, or to discuss your business strategy, Contact Us.
Or, check out our other Dashboard Deep Dives: